
From 2007 to 2012
This was the main focus during my PhD and several years after. Despite the fact that a lot of work has been poured here, some of the results were not that spectacular and there are plenty of more areas to be explored.
Automatic left/right discrimination
In 2007 I started receiving ultrasound images from our partners. Most of the images were from liver, taken under several visualization angles.
Below, shows two ultrasound images of the liver, one from the left part of the liver, one from the right. They can’t be distinguished using meta information. The visual appearance is the only way to discriminate.

Ultrasound image taken from the left liver lobe
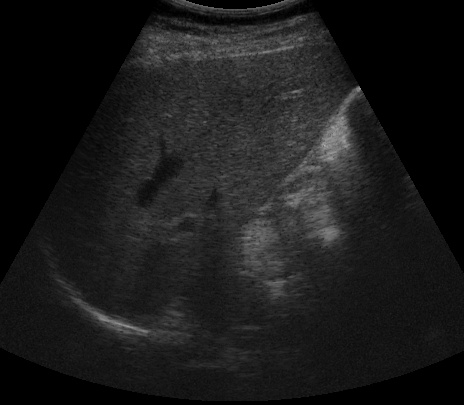
Ultrasound image taken from the righ liver lobe
In the beginning I created and used a simple GUI to semi-automatically label the images, with some metadata, from DICOM. But as the database grew large, setting the image origin label (left/right) become cumbersome.
I devised an end-to-end ML system that ingests US images and labels them. This was a very important success because I was quite novice in working with ML and because it had to work close to 100% performance. System was trained on 1000 images and manually evaluated on 5000 images. First versions of the ML pipeline used rather crude texture analysis plus a SVM classifier. Later versions, used local structure tensors and bandpass filters, without significant improvements. Latest reported error rate was 0.92%. [“Automatic detection of liver capsule using Gabor filters. Applications in steatosis quantification“]
Fibrosis detection based on US images
This was probably the hardest part of the projects. It also has an interesting story, because in the end I showed why this is “not that easy” and most importantly I showed how it can be detected and why it can’t be detected solely based on ultrasound imaging.
In years 2000 – 2010, State Of The Art in US based fibrosis detection was taking a small window out of the whole ultrasound image, compute some numbers using highly sophisticated texture descriptors and then feed all these, to a classifier. Bayes, trees, logistic regression, SVM, etc etc. Most of the papers, reported detection performances around 90 percent or more.
My pipeline? Around 70%. Slightly better than random. Well, quite stressful, until (1) Gained more confidence in my ML skills, (2) Started to get the gist about whole scientific publishing scene.
At a “closer” look of those papers doing 200% detection accuracies, I realized that they induced a subtle overfitting. Most of them, selected several windows from each image (perfectly legit), randomize them (well, not quite ok) and then split in train/test. Some, went a bit further, from the same image, they selected several regions in training set and one or two, in testing set (blunt evil). Poor me, patient level splitting, stratification of the patient lot and a three way split (train, validation for parameter search and test for reporting). No wonder my results were all over the place . . .
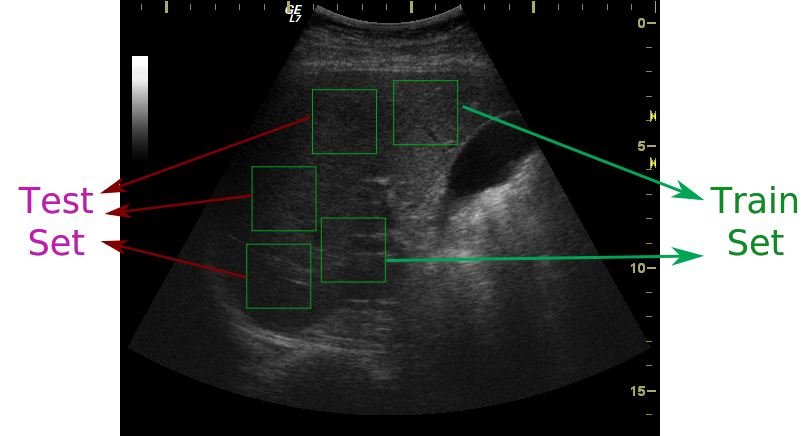
Take several patches from an image and place them in different sets! What can go wrong? Perfect data augmentation, if one wants to identify patients by their ultrasounds!
Another evil thing was that when I tried to report my findings [by trying to publish negative results], I constantly got the feedback that these problems were already known. Well, WTF moment.
I rolled my sleeves and tried to answer the “Why” question. Not why nobody said anything about it but why the fibrosis is not detected from ultrasounds?
It turned out that even the slightest manipulation in data ingestion could trigger overfitting. Slight change in image parameters? Detected by ML. Change in human operator? Detected by ML! These were “easy”, it only took several rounds of labeling and some statistics. [Check “Influence of Expert-Dependent Variability over the Performance of Noninvasive Fibrosis Assessment in Patients with Chronic Hepatitis C by Means of Texture Analysis” paper.] Ok, these were blocked, what else is there to interfere with the ultrasound image?
Before moving on to answer the above question is worth noting that I detected Fibrosis by feeding regular biochemical and biological clinical laboratory measurements to a ML. Not Nobel worthy in terms of novelty, but effective. [“Detection and Staging of Liver Fibrosis Using Additive Logistic Models” paper] However, I was in the image processing research!
Ultrasound image simulation
The creation of an US image is a complex process where sonic waves are interfering at the sensor, creating that specific speckled aspect of the images. ML must detect subtle differences and hopefully some of those differences are created by our pathology! Well, not quite. I created a model of the liver tissue and placed it under a virtual US probe.
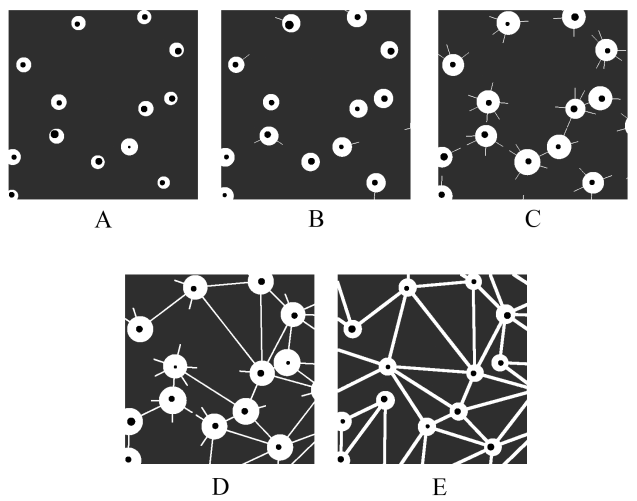
This is a visualization of the tissue model, with various disease stages (A->E)
Having some compute power on my hand, I played with a lot of parameters! I tuned the healthy tissue parameters (within known anatomical variations) and the degree of the fibrosis disease (or staging, how is called in medical terms). Simulating US takes a lot of time in the case of dense tissue, because the software must compute the reflection of each tissue micro-element towards each receiving crystal. Nonetheless, I generated a lot of images! And these images, were fed to the ML pipeline.
The experiments lead to the conclusion that the quantity of fibrosis has a bigger impact on the speckles than how this fibrosis is distributed in the tissue. Unfortunately, exactly this distribution, has the biggest clinical relevance!
For more details on tissue simulation and results, check “Usefulness of Textural Analysis as a Tool for Non-Invasive Liver Fibrosis Staging” or its draft in my list of published papers.
There are a lot of paths left to be explored. The liver capsule is affected by the growing fibrosis nodules. There are several more modalities acuqired from each patient (like 3D or high frequency). While back then, they did not yield any useful information, maybe will worth a second look at some point.